
Healthcare spending reached $11,200 per American in 2018 – a 290% increase since 1980.1 Nunn R, et al. A dozen facts about the economics of the U.S. Health-Care System. The Hamilton Project. Economic Facts. March 2020. Available at: … Continue reading It is twice the average for other countries – 17.1% of Gross Domestic Product (GDP) in 2017 – and higher than other large advanced economies such as Germany (11.2%) and the United Kingdom (9.6%).
Spending on healthcare is also highly variable, with prices for the same service up to 9.3 times higher in one city compared to others.
So why does all this matter?
High spending on healthcare matters because it means there is a lot less money available to spend on other things we want and need. When we spend more on healthcare, we have less to fund quality education, social services, transportation, infrastructure, and criminal justice.
High variability in spending matters because it means we are overpaying.
So what can we do about it?
In short, we need to be able to determine the right price. And that’s not always the lowest price. Rather, we need to be able to look at price in the context of quality.
We need to be able to assess value in healthcare.
And that’s the purpose of this article – to demonstrate 3 simple steps to assess value in healthcare that enable us to make profitable decisions for individuals, organizations, and society.
By the end of this article, you will be able to:
- Recognize the benefits of skills to assess value in healthcare
- Identify common barriers to assessing value in healthcare
- Apply 3 simple steps to assess value in healthcare
The Problem: Assessing Value in a Broken Market
We are spending more and more on healthcare. But are we getting our money’s worth?
In most areas in our lives, we know when we’re getting what we paid for, and when we’re not. Most markets provide us with all the information we need in two critical categories – price and quality. With plenty of information to compare prices and quality for TVs, appliances, and cars, we gain confidence we are purchasing value.
But healthcare is different. Consider that in healthcare, we rarely have comparative information for price or quality. Thus, healthcare is a broken market by definition.
Unfortunately, since quality of healthcare is particularly difficult to assess, decisions are often made based only on prices (i.e., acquisition costs). In aggregate, cheap products and services with lots of hidden downstream costs dominate the landscape. Even more, they block the impact pricier, “high-value” interventions could have on individuals, organizations, and society.
The Solution: 3 Simple Steps to Assess Value in Healthcare
Although value assessment in healthcare is complicated, we have a secret weapon. We can follow the same approach we use to assess value for TVs, appliances, and cars. We simply need to 1) gather information on price and quality, and 2) interpret that information.
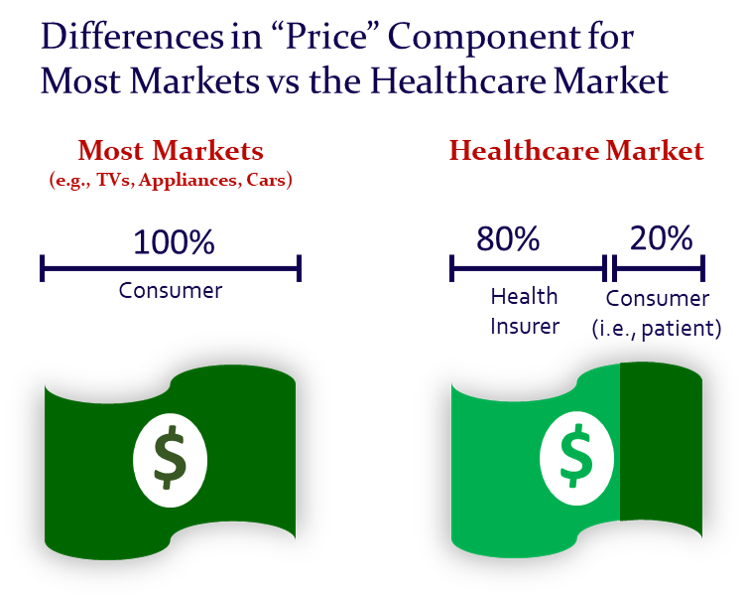
First, let’s consider price in healthcare.
Price in healthcare is not as straight-forward as in other industries. For example, if we want a car, we go pay for one… all of it. In healthcare, we typically share the expenses with our insurance companies. Often, the insurance company pays for the majority (i.e., 80%+), and we pay the rest in the form of a copay and/or coinsurance.
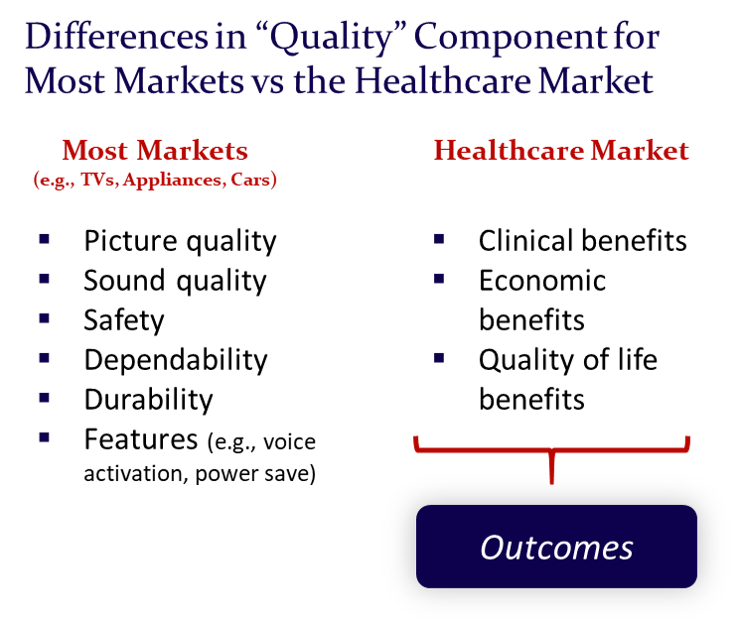
Second, let’s consider quality in healthcare.
Quality in healthcare is also a bit different than in other industries. For example, quality of cars might be rated on factors like dependability, safety, engine power, etc.
But what does quality in healthcare look like? Is it measured by time to heal… or change in blood pressure… or ability to function… or even length of life?
The answer is YES.
Quality in healthcare can be all of these things and more.
The good news is that we can translate quality in healthcare into a single term. That term is outcomes. And while there are many different types of outcomes, healthcare interventions should impact outcomes in positive ways.
Now that we understand our target for value assessment in healthcare, we can get started.
Below we demonstrate a simple 3-step process to assess value in healthcare. The process will work whether the intervention is a drug, medical device, service, or complex program.
Here is the process:
- Build the pricing picture
- Build the outcomes picture
- Bring the pricing and outcomes pictures together
Step 1: Build the Pricing Picture
The first step of our 3-step process to assess value is to build the pricing picture. We need to quantify “what we pay.”
Our first consideration in building the pricing picture is to choose a perspective. We need to decide whose costs we want to consider in our analysis. In healthcare, costs are often shared by a mix of key stakeholders–health insurers, employers, and patients–that combine to cover the full costs of any given intervention.
So what does it look like to get pricing data in healthcare?
In the absence of direct spending data from our own bank account, we use published sources. These may be found in the published literature or through data providers. We often use these sources when we are estimating costs or modelling the impact of interventions prior to their market availability.
For example, we can find pricing data for medications from government sources like the Centers for Medicare & Medicaid Services (CMS) pricing (CMS Medicare Part B ASP files).2 CMS. Medicare Part B Average Sales Price. Available at: https://www.cms.gov/Medicare/Medicare-Fee-for-Service-Part-B-Drugs/McrPartBDrugAvgSalesPrice. Accessed February 2021.
Ideally, we have a data source that shows our actual costs – real-world data. This data is more specific to our particular business situation. For example, a self-insured employer would have monthly reports of exactly what they spend on specialty drugs. Or a health insurer would see their total spending on hospitalizations by diagnosis each month.
If we have this kind of direct spending information, we use it!
Now that we have pricing data, we need to pull the quality information (i.e., outcomes).
Step 2: Build the Outcomes (i.e., Quality) Picture
The second step of our 3-step process to assess value is to build the outcomes picture.
It’s quantifying the “what you get” part.
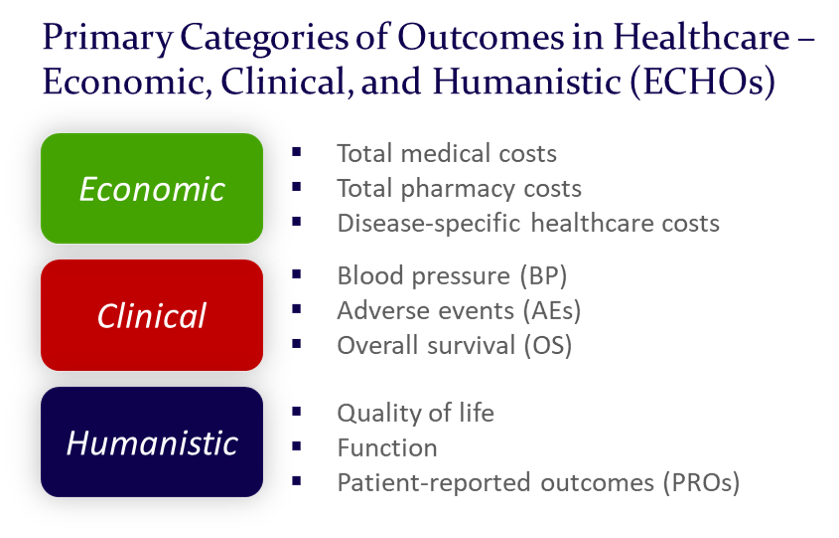
In healthcare, we have many ways to measure outcomes. We can broadly classify these into 3 primary categories: Economic, Clinical, and Humanistic Outcomes. We can remember these with the acronym ECHOs.
Once we know what type of information we want (i.e., what aspect of “what you get” that is most important to us in a given therapeutic area or disease state), we’ll want to determine the source for the data.
Similar to our discussion above, we have two options for sourcing information on outcomes: 1) published/literature-based or 2) real-world data (i.e., actual).
For published data, the best way to start is a web search. A web search for the therapeutic area we are interested in and “outcomes” will reveal many sources to evaluate for the outcomes data we need.
Even more specifically, the website at Pubmed is an excellent repository of published medical research (https://pubmed.gov).
In oncology, top clinical outcomes metrics are overall survival (OS), progression-free survival (PFS), and response rates (RR). When searching for published research in oncology, we look for specific OS, PFS, and RR data to capture as inputs for our value assessment.
Similar to our pricing discussion, ideally we have real-world outcomes information to guide our value assessment. Real-world data are even better because they highlight the actual results we are paying for rather than hypothetical results informed by clinical trials and other sources from various health systems, regions, etc.
Step 3: Bring the Pricing and Outcomes Pictures Together
The third and final step of our 3-step process to assess value is to bring the pricing and outcomes pictures together.
It’s time to build the context around the pricing and outcomes data we’ve gathered so far to give them meaning… to quantify value.
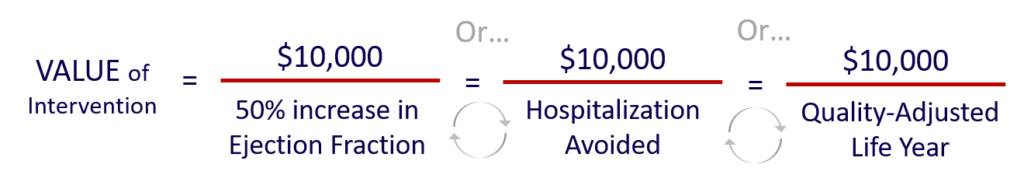
While value assessment in healthcare seems complicated, there is a simple and powerful formula we can use in nearly every assessment.
This formula helps us bring our pricing and outcomes data together into a single view:

With this simple formula, we are quantifying value as the price we paid for the outcomes we gained.
And here’s the really powerful part…
We can simply cycle in and out each and every outcome of interest we have to get a more robust view of the value of the intervention. We can think of the denominator of this equation (i.e., outcomes) as a rolodex switching in and out specific outcomes of interest for our evaluation.
This formula delivers impressive insight into the value of our intervention. We have the ability to quantify its value across any outcomes dimensions we want… as long as there are data available.
We can extend the power of this formula even further when we use it to make comparisons.
Consider that for Product X we are paying $10,000 per month of additional survival. For Product Y, we are paying $7,500 per month of additional survival. Now we have a clear picture that Product Y delivers more value since we pay less for equal outcomes.
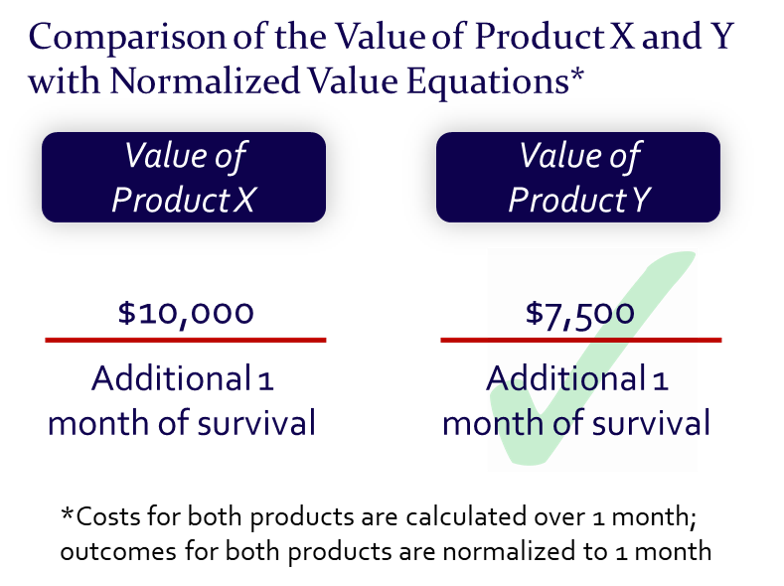
In order to take advantage of such comparisons, we only need to make sure we have like terms in our numerator and our denominator… that the data are “normalized.”
For the numerator, we want to make sure our costs cover the time-frame over which the outcomes benefit is delivered. In our example above, this means Product X and Y costs over 1 month.
For the denominator, again we need to make sure our outcomes data for both Products X and Y are available over the same time-frame. In this case, survival data is available in the format of per 1 month of survival.
With normalized pricing data in our numerator and outcomes data in our denominator, our comparisons are unlimited.
Conclusion: 3 Simple Steps to Assess Value in Healthcare
We have reviewed the critical need to assess value in healthcare. We are spending more and more for healthcare. But we remain unsure if we are getting what we are paying for.
While value assessment in healthcare requires skills, it doesn’t have to be complicated.
Above we presented 3 simple steps to assess value in healthcare:
- Build the pricing picture
- Build the outcomes picture
- Bring the pricing and outcomes picture together
We hope you have found this article useful in your own value assessment efforts. If you have any questions or comments, please contact us here.
We also created a downloadable summary for our 3 simple steps to assess value in healthcare which you can access here –>
References
| 1 | Nunn R, et al. A dozen facts about the economics of the U.S. Health-Care System. The Hamilton Project. Economic Facts. March 2020. Available at: https://www.brookings.edu/wp-content/uploads/2020/03/HealthCare_Facts_WEB_FINAL.pdf. Accessed February 2021 |
|---|---|
| 2 | CMS. Medicare Part B Average Sales Price. Available at: https://www.cms.gov/Medicare/Medicare-Fee-for-Service-Part-B-Drugs/McrPartBDrugAvgSalesPrice. Accessed February 2021. |