
Something dramatic happened in the US healthcare market in 2015.
Something with implications for all healthcare stakeholders, including providers and institutions.
Specifically, the value of drug products was being quantified and put on display for the entire market to see.
Sure, the value of medical products had been formally evaluated for decades before…
…but this was different.
Policy and provider groups were now publishing their own approaches to determining value in healthcare. Specifically, they focused on the value of pharmaceuticals.
And while these value frameworks are confined to the pharmaceutical market, it won’t be long until similar approaches start escalating to evaluate providers and institutions.
That’s why it is important for healthcare providers and executives to understand these value frameworks. Those that do will be ideally positioned to quantify and prove their own value and profit by delivering that value.
At first glance, these frameworks can seem complicated and overwhelming.
But anyone can understand them.
And I wrote this brief article to do just that… help you quickly understand them so you can apply them to your own healthcare business.
In this article, I will briefly review these frameworks and go over their components. You’ll understand some of the key similarities and differences between the frameworks. You’ll also be able to start and join conversations about these things, which seem quite complicated on the surface, but can be easily understood by most with just a little effort.
Of course, you should always feel free to reach out to me directly through our ‘CONTACT‘ page if you’d like further information.
Introducing the Value Frameworks
As of the writing of this article, the following value frameworks have been released:
- European Society for Medical Oncology’s Magnitude of Clinical Benefit Scale (ESMO-MCBS) (May 2015)
- American Society of Clinical Oncology (ASCO) (June 2015; Updated June 2016)
- National Comprehensive Care Network (NCCN) Evidence Blocks (October 2015)
- Memorial Sloan Kettering Cancer Center’s (MSKCC) DrugAbacus (June 2015)
- Institute for Clinical and Economic Review (ICER) Value Assessment Project (September 2015)
Of note, the first 3 listed above – ESMO, ASCO, and NCCN – are produced and distributed by professional medical society organizations. They are designed for use by providers and patients to aid individual patient treatment decisions.
The latter 2 – MSKCC DrugAbacus and ICER – are created by policy organizations. Their focus is on providing analysis and reporting to help population-level decision makers in healthcare.
Of particular interest, 4 out of 5 of these value frameworks include costs. Traditionally, comparative frameworks in the US have focused solely on clinical benefits. The inclusion of costs in value frameworks is a strong testimony to the sea-change moment in healthcare of proving value the industry is facing.
Additionally, 4 out of 5 of these frameworks are focused solely in oncology, a notoriously expensive therapeutic area.
Preliminary Key Insights
Before we get too far into the weeds, there are a couple of key insights worth sharing.
First, each of these value frameworks was developed by groups of very intelligent people – many of them physicians and PhD’s. Even so, each of them is quite different from the other. They have very different methodology, structure, and perhaps most importantly, results and output.
Consider this fact telling telling to the complexity of any exercise trying to quantify value in healthcare.
Quantifying value in some cases may be straight-forward. For example, 21 months of median overall survival is certainly more valuable than 10 months. But the value exercise gets complicated quickly because it is subjective in nature. Not only do the elements of value look different from person to person, but they also change within the same person over time. The same patient whose initial goal is to stay working may revise their goals to being pain-free after a couple of months of treatment.
Second, it remains to be seen just which value frameworks will be used by whom and how often.
Stakeholders in healthcare include payers (i.e., health insurers), providers, institutions, advocacy groups, researchers, pharmaceutical manufacturers and the patient. You’ll see below that each framework is intended for use by 1 or 2 of these groups. But each framework addresses a different set of stakeholders. The passing of time will reveal any particular “winners” in terms of which value frameworks rise to the top.
Third, while the frameworks speak to the importance of value from the patient perspective, they include very few patient components in their construction. Notable exceptions include patient reported outcomes (PROs) and patient copay. However, even when these elements are included their impact tends to be overshadowed by clinical trial efficacy and safety data.
In defense of the frameworks, the limited focus on patient outcomes is likely due to a paucity of this type of data. These products rely on FDA’s regulatory approval which emphasizes efficacy and safety data, not patient-reported outcome data.
Regardless, this deficiency is worth noting in the age of rising healthcare consumerism. Ultimately, value frameworks could either 1) motivate drug manufacturers to deliver more of the same kind of evidence the frameworks already reward, or 2) motivate manufacturers to start including more patient-centric metrics in their trials. We’ll have to wait and see.
The European Society of Medical Oncology (ESMO) Value Framework1 [1. Cherny NI, et al. A standardised, generic, validated approach to stratify the magnitude of clinical benefit that can be anticipated from anti-cancer therapies: the European Society for Medical … Continue reading
We’ll start with a framework sponsored by an ex-US organization, the European Society of Medical Oncology (ESMO).
ESMO developed the Magnitude of Clinical Benefit Scale and published the framework in late May 2015 as a journal article.2 [1. Cherny NI, et al. A standardised, generic, validated approach to stratify the magnitude of clinical benefit that can be anticipated from anti-cancer therapies: the European Society for … Continue reading
The paper presents a detailed description of the methodology applied to develop the framework for scoring oncology treatments across two sets of forms. The forms developed were then used to evaluate existing oncology treatments and the results were published.
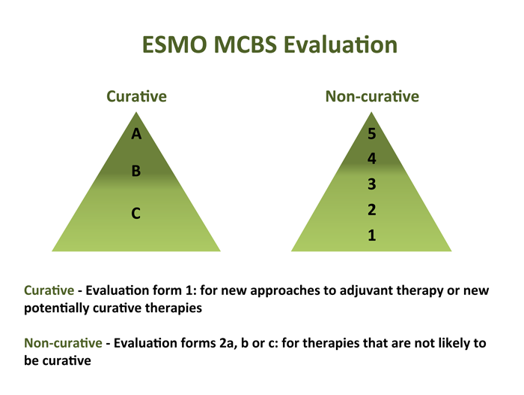
Figure 1. ESMO MCBS Evaluation Scoring Scales
| Summary of European Society of Medical Oncology (ESMO) Magnitude of Clinical Benefit Scale (MCBS) Value Framework | |
|---|---|
| FORMAT: | Publication from May 2015 presents the methodology and the results for 77 cancer drugs |
| PERSPECTIVE: | For physicians to use to help assess the best treatments for their patients |
| PRODUCTS: | 77 cancer medicines across 10 cancer types |
| EVIDENCE: | 1 trial at a time |
| SCORING: | – Curative therapies assigned a score from best to worst of A to C; non-curative treatments assigned a score from best to worst from 5 to 1 – The ESMO panelists developed scoring sheets and then ran clinical trial data through the scoring sheets to generate the assigned scores to each drug — Clinical trial data included OS, PFS, DFS, RR, Toxicity, and QoL were included |
| OTHER: | – This framework does NOT include costs which is unique to the frameworks covered in this article – There are plans for ESMO to update their framework with new oncology treatments as they come to market – ESMO is open to feedback for revisions |
The American Society of Clinical Oncology (ASCO) Value Framework3 [2. Schnipper LE, et al. American Society of Clinical Oncology statement: A conceptual framework to assess the value of cancer treatment options. JCO. 2015;33:2563-2577], 4 [3. Schnipper LE, et al. Updating the American Society of Clinical Oncology value framework: Revisions and reflections in response to comments received. JCO. 2016;1-15]
Next, we’ll take a look at ASCO’s value framework. Similar to ESMO’s framework, the ASCO value framework took the form of a publication in its original version[2. American Society of Clinical Oncology statement: A conceptual framework to assess the value of cancer treatment options. JCO. 2015;33:2563-2577] and updated version5 [3. Schnipper LE, et al. Updating the American Society of Clinical Oncology value framework: Revisions and reflections in response to comments received. JCO. 2016;1-15]
These publications describe the methodology for developing the ASCO value framework, present scoring sheets, and demonstrate the use of the scoring sheets in example therapeutic areas (breast cancer, prostate cancer, lung cancer, and multiple myeloma).
Similar to ESMO, this framework is intended to be used by physicians to help them make treatment decisions for their patients. One small difference is that the tool is intended to be used in consultation between provider and patient, not solely by the provider prior to speaking with the patient.
The ASCO value framework includes 2 different scoring sheets – one for advanced disease and another for adjuvant therapy. Here is the most recent scorecard for advanced disease:
Figure 2. ASCO Value Framework Scorecard for Advanced Disease


The adjuvant scorecard is similar except the following:
- Use of hazard ratios for survival or disease-free survival metrics for efficacy only
- “Bonus points” only awarded for tail of the curve benefits
| Summary of American Society of Clinical Oncology (ASCO) Value Framework | |
|---|---|
| FORMAT: | Scoring sheets provided in a publication in the June 2015 issue of ASCO’s Journal of Clinical Oncology |
| PERSPECTIVE: | Intended to be a guide for the physician and patient at the point of care to aid treatment decisions |
| PRODUCTS: | Any oncology drug (data permitting) |
| EVIDENCE: | 1 trial at a time |
| SCORING: | Includes the following domains of value used to calculate the Net Health Benefit (NHB) score: – Efficacy – Toxicity – Bonus Points – improvement in cancer-related symptoms; treatment-free interval Includes costs in the form of: – Drug acquisition cost (DAC) – Patient copay NHB is presented next to cost elements (i.e., clinical and economic data are not aggregated into a single value) Two scorecards provided – Advanced disease – Adjuvant setting |
| OTHER: | – Scorecards can be used for any oncology drug, as long as the data are available – ASCO expects continued refinement based on comments from key stakeholder groups – There is an ultimate vision to feed such scoring systems with real-world oncology data from platforms like ASCO’s CancerLinq (http://www.instituteforquality.org/cancerlinq) – Unclear if and how physicians will actually use this with their patients given lack of information, especially with regards to costs |
The National Comprehensive Cancer Network (NCCN) Evidence Blocks6 [4. NCCN. Evidence Blocks. Available at: http://www.nccn.org/evidenceblocks/. Accessed March 2016]
The NCCN has developed its own framework to allow for easy comparisons across treatment options.
Similar to the ESMO and ASCO value frameworks, NCCN’s Evidence Blocks are designed to inform the provider-patient treatment decision at the point of care.
We will avoid using the term “value framework” to describe NCCN’s work here because they are intentionally avoiding use of the term themselves. Their leadership has stated a desire to avoid using the term “value” given its subjective nature.
The evidence blocks look quite different from the other frameworks. They are presented as publications that look like their very well-known NCCN Guidelines with additions. These additions are literally 5 x 5 square tables with varying degrees of blue colored boxes. The boxes represent the “score” for a given treatment across the 5 included domains in this framework. The more boxes colored in means the more favorable the treatment is across the 5 dimensions of value included.
Figure 3. NCCN Evidence Block Illustration and Scoring

The process for developing these blocks for each therapeutic regimen is as follows:
- NCCN Guideline Committees comprised of clinical experts not employed by NCCN and specific to a given therapeutic area complete scoring sheets to use in the evaluation of all the therapeutic treatments in their given therapeutic area
- Committee members score each regimen on their own and return their scores to the NCCN personnel
- NCCN organization personnel average the scores and generate the assigned blocks to each regimen/treatment
- Evidence blocks are published (and ostensibly updated) as they are developed by each individual therapeutic area committee
NCCN released its first 2 evidence blocks in the therapeutic areas of chronic myelogenous leukemia (CML) and Multiple Myeloma in October of 2015. Since then, they have released several others in the areas of kidney cancer, breast cancer, melanoma, and prostate cancer among others. You can find all of them listed on NCCN’s website HERE.
| Summary of National Comprehensive Cancer Network (NCCN) Evidence Blocks | |
|---|---|
| FORMAT: | Published evidence blocks merged with traditional NCCN Guidelines |
| PERSPECTIVE: | For providers to use with patients to help make treatment decisions |
| PRODUCTS: | Oncology treatments by therapeutic area (10 released to date) |
| EVIDENCE: | The body of evidence considered by those who develop the guidelines and evidence blocks |
| SCORING: | Scores oncology treatments and regimens across 5 domains from 1 (worse) to 5 (best):Efficacy: the Efficacy measure is the extent to which an intervention is helpful in prolonging life, arresting disease progression, or reducing symptoms of a medical condition.Safety refers to the assessment of the relative likelihood of side effects from an intervention with fewer side effects being scored highly.Quality and quantity of evidence refers to the number and types of clinical trials relevant to a particular intervention. To determine a score, panel members may weigh the depth of the evidence, i.e., the numbers of trials that address this issue and their design. The scale used to measure quality of evidence isConsistency of evidence refers to the degree to which the clinical trials addressing an intervention have consistent results.Affordability refers to the overall cost of an intervention including drug cost, required supportive care, infusions, toxicity monitoring, management of toxicity, probability of care being delivered in the hospital, etc. with less expensive interventions being rated more highly than more expensive ones.The exact scale for each of these measure is somewhat subjective – there are no quantitative ranges assigned to the 1 through 5 scoring. For example, affordability has no dollar ranges assigned to 1, 2, 3, 4, or 5. Rather their scale ranges from “Very expensive” to “Very inexpensive.” You can find the details HERE under the NCCN Evidence Blocks™ Categories heading. |
| OTHER: | Presented as little pictures of blocks assigned to each therapyPublished within the traditional NCCN clinical guidelines that are developed by teams of 30 to 50 therapeutic expertsThe teams that develop the guidelines will incorporate evidence block scoring into future guidelines; the publication of different therapeutic areas will follow the update scheduleFirst 3 released at time of publishing this article |
| Summary of National Comprehensive Cancer Network (NCCN) Evidence Blocks | |
|---|---|
| FORMAT: | Published evidence blocks merged with traditional NCCN Guidelines |
| PERSPECTIVE: | For providers to use with patients to help make treatment decisions |
| PRODUCTS: | Oncology treatments by therapeutic area (10 released to date) |
| EVIDENCE: | The body of evidence considered by those who develop the guidelines and evidence blocks |
| SCORING: | Scores oncology treatments and regimens across 5 domains from 1 (worse) to 5 (best): – Efficacy: the Efficacy measure is the extent to which an intervention is helpful in prolonging life, arresting disease progression, or reducing symptoms of a medical condition. – Safety refers to the assessment of the relative likelihood of side effects from an intervention with fewer side effects being scored highly. – Quality and quantity of evidence refers to the number and types of clinical trials relevant to a particular intervention. To determine a score, panel members may weigh the depth of the evidence, i.e., the numbers of trials that address this issue and their design. The scale used to measure quality of evidence is – Consistency of evidence refers to the degree to which the clinical trials addressing an intervention have consistent results. – Affordability refers to the overall cost of an intervention including drug cost, required supportive care, infusions, toxicity monitoring, management of toxicity, probability of care being delivered in the hospital, etc. with less expensive interventions being rated more highly than more expensive ones. The exact scale for each of these measure is somewhat subjective – there are no quantitative ranges assigned to the 1 through 5 scoring. For example, affordability has no dollar ranges assigned to 1, 2, 3, 4, or 5. Rather their scale ranges from “Very expensive” to “Very inexpensive.” You can find the details HERE under the NCCN Evidence Blocks™ Categories heading. |
| OTHER: | – Presented as little pictures of blocks assigned to each therapy – Published within the traditional NCCN clinical guidelines that are developed by teams of 30 to 50 therapeutic experts – The teams that develop the guidelines will incorporate evidence block scoring into future guidelines; the publication of different therapeutic areas will follow the update schedule – First 3 released at time of publishing this article |
The Memorial Sloan Kettering Cancer Center (MSKCC) DrugAbacus 7 [5. MSKCC. DrugAbacus. Available at: http://drugabacus.org. Accessed March 2016]
The Abacus is quite different from the previous value frameworks.
First, it has a very different target audience. The audience for the DrugAbacus is population health decision-makers, not individual physicians and patients like the previous frameworks we’ve discussed.
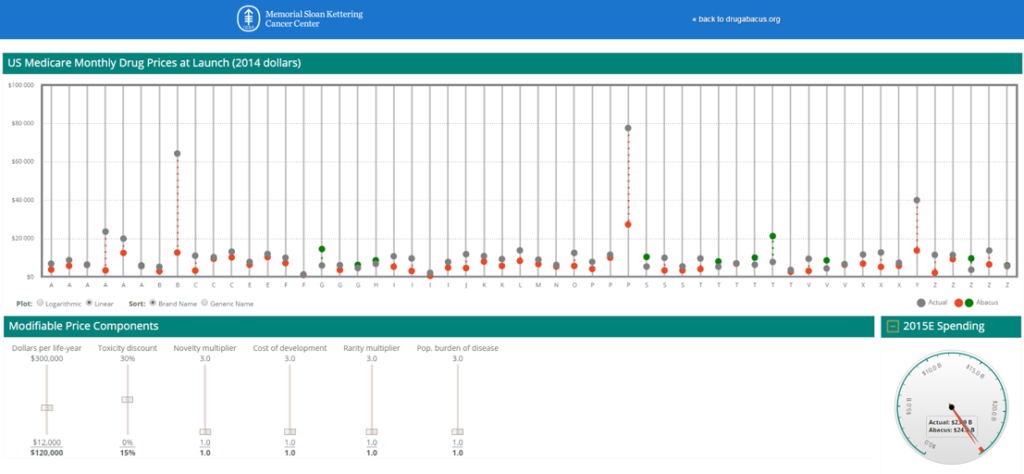
Second, the DrugAbacus takes the form of an interactive web app rather than a publication. It is essentially a sophisticated calculator made available for all at a web address. Furthermore, the results output actually looks like an abacus. Each bar on the virtual abacus represents one of the 54 cancer drugs included in the analysis.
The DrugAbacus is interactive, as well. It allows the user to change weightings for value domains and apply filters by drug name and disease type.
Here’s how it works…
Each pole in the abacus display is assigned to one drug.
The DrugAbacus takes pre-programmed data associated with each drug, user inputs like value weightings and filters, and calculates an “Abacus Price” considered a “fair” price. This Abacus Price is then plotted for comparison against the actual price charged by the manufacturer. The actual price is plotted as a black dot on the abacus pole. The Abacus Price is plotted as a red dot when it is higher than the abacus price (indicating poor value for a given price) and a green dot when it is lower than the abacus price (indicating favorable value for a given price).
Figure 3. Screenshot of the MSKCC DrugAbacus Web Application
Of note, the DrugAbacus may be the least transparent of the frameworks presented here.
It has been heavily programmed. For example, the base prices for the 54 drugs included are the launch prices. In addition, drugs with multiple indications are only included for their launch indication. For example, although Afinitor has indications in both renal and breast cancer, it only shows up in the Abacus for its renal indication.
The methodology reports that trial data is used to generate the elements of value for each drug. However, how the clinical data are translated into value scores is unclear.
In addition, those of us digging into these models recognized early that the published formula provided by the DrugAbacus has a problem. Here is what was published as the calculator formula:

Looking at this formula, we quickly realize that any one of the value domains we set to “zero” will zero-out the entire equation. Of note, the novelty value domain rarely exceeds zero since only a handful of these agents are truly first-in-class.
As such, we’ve done some work to determine how the calculations are actually performed. If you’re interested, you can click HERE to see how to run the calculations.
| Summary of Memorial Sloan Kettering Cancer Center (MSKCC) DrugAbacus Value Framework Calculator | |
|---|---|
| FORMAT: | Web-based application |
| PERSPECTIVE: | Payers and Population Health Decision-makers |
| PRODUCTS: | 54 cancer drugs |
| EVIDENCE: | 1 trial at a time, first indication and launch price |
| SCORING: | Includes the following domains of value used to calculate the Abacus Price for comparison to the actual price:EfficacyTolerability (i.e., safety profile)Novelty of drugCost of drug development (i.e., research and development investments)Rarity of disease multiplierPopulation burden of diseaseAbacus price calculated for comparison with actual price; the Abacus price is considered to be the “fair” price for the drug given inputs the user selectsCosts determined by Medicare allowable charge – 106% of ASP, 95% of AWP or Cost of Drug in PlanFinder for the Humana PDP Enhanced plan for a beneficiary in ZIP code 10021 |
| OTHER: | Much of this tool has pre-programmed data inputsAssigned therapeutic areas and costs are based on the 1st approval and launch price; prices in this model were not inflated to a single, contemporary dateMethodology is not very transparent and leaves obvious questions. For example, the novelty multiplier is often “0” – placed in the published formula on the DrugAbacus website, the entire formula would collapse (i.e., equal 0).Update plan is unclearOne of the few frameworks to include “market factors” such as R&D costs, rarity of disease and population health burden, although their methodology may not be ideal (e.g., # patients proxy is limited the way drugs actually come to market with many failures leading to 1 success; population health burden usually is inversely related to drug price while in the Abacus it is directly related)Cannot include combination therapies as currently constructed |
| Summary of Memorial Sloan Kettering Cancer Center (MSKCC) DrugAbacus Value Framework Calculator | |
|---|---|
| FORMAT: | Web-based application |
| PERSPECTIVE: | Payers and Population Health Decision-makers |
| PRODUCTS: | 54 cancer drugs |
| EVIDENCE: | 1 trial at a time, first indication and launch price |
| SCORING: | Includes the following domains of value used to calculate the Abacus Price for comparison to the actual price: – Efficacy – Tolerability (i.e., safety profile) – Novelty of drugCost of drug development (i.e., research and development investments) – Rarity of disease multiplier – Population burden of disease Abacus price calculated for comparison with actual price; the Abacus price is considered to be the “fair” price for the drug given inputs the user selects – Costs determined by Medicare allowable charge – 106% of ASP, 95% of AWP or Cost of Drug in PlanFinder for the Humana PDP Enhanced plan for a beneficiary in ZIP code 10021 |
| OTHER: | – Much of this tool has pre-programmed data inputs – Assigned therapeutic areas and costs are based on the 1st approval and launch price; prices in this model were not inflated to a single, contemporary date – Methodology is not very transparent and leaves obvious questions. For example, the novelty multiplier is often “0” – placed in the published formula on the DrugAbacus website, the entire formula would collapse (i.e., equal 0). – Update plan is unclear – One of the few frameworks to include “market factors” such as R&D costs, rarity of disease and population health burden, although their methodology may not be ideal (e.g., # patients proxy is limited the way drugs actually come to market with many failures leading to 1 success; population health burden usually is inversely related to drug price while in the Abacus it is directly related) – Cannot include combination therapies as currently constructed |
The Institute for Clinical and Economic Review (ICER) Value Assessment Framework 8 [7. ICER. Value Assessment Project. Available at: http://www.icer-review.org/impact-and-outcomes/value-assessment-project/. Accessed March 2016]
The final value framework we will discuss in this article may be the one that is having the most impact in the US healthcare system so far.
Like the DrugAbacus, ICER’s Value Assessment Project framework is geared towards population health decision-makers. Their analyses and reports are not for providers to use with individual patients like the ESMO, ASCO, and NCCN value frameworks.
With their evaluations, ICER is taking a much more traditional health technology assessment (HTA) approach.
HTA assessments are common in countries outside of the US with primarily a single payer system (i.e., government). In these systems, the government payers for healthcare have been requiring sophisticated HTA analyses as part of their regulatory approval processes. These governments are looking to ensure a societal benefit is returned from their investments in drugs.
Mimicking this approach, ICER tackles new and emergent drugs. They will also review older drugs as part of class reviews in important therapeutic areas that may include newer agents.
Their output is in the form of sophisticated reports. These reports presents results from analyses regarding the perceived value of the products included. Specifically, ICER’s evaluation includes a cost-effectiveness analysis (CEA) and a budget impact analysis (BIA). Both are very traditional HTA methodological approaches.
Figure 4. Institute for Clinical Effectiveness Research (ICER) Value Assessment Framework Approach

In addition, ICER takes their analysis a couple of steps farther.
First, they establish a value-based price benchmark (VBPB). The VBPB is the lower cost figure from both the CEA and BIA results.
Second, they address the affordability issue.
You see, drugs may be cost-effective and a good value yet still be unaffordable from the societal perspective. A textbook example of this is the recently approved agents for the treatment/cure of Hepatitis C. Because these drugs represent a cure for most patients, they proved cost-effective from HTA analyses even at prices ranging from $60,000 to $90,000 per course. The problem is that estimates of the prevalence of Hepatitis C in the US exceed 3,000,000 people. It would be considered unaffordable for all of these patients to cost the system $180 billion to $270 billion.
As such, ICER’s framework establishes an approximately $1,000,000,000 threshold over the first 5 years on the market.
Of note, ICER’s reports are actually being cited by payers in negotiations with drug manufacturers to set pricing. The fact they are actually driving market pricing elevates the significance of their body of work perhaps over the others we’ve presented here.
It seems that ICER is finally bringing HTA to the USA.
| Summary of the Institute for Clinical & Economic Review (ICER) Value Assessment Project | |
|---|---|
| FORMAT: | Published reports on specific drug class(es) or drug product(s) |
| PERSPECTIVE: | Payers and Population Health Decision-makers |
| PRODUCTS: | Drugs and therapeutic areas with looming FDA approval dates targeted for evaluation |
| EVIDENCE: | The body of evidence is considered |
| SCORING: | The evaluation process is comprehensive and includes the following categories of analysis: Comparative Clinical Effectiveness, Incremental Cost Per Outcomes Achieved, Other Benefits or Disadvantages, Contextual Considerations, and Care Value – Comparative Clinical Effectiveness with the ICER Evidence-Based Medicine matrix – Incremental Cost Per Outcomes Achieved: High care value = <$100,000/QALY, Intermediate Care Value = $100 – $150 K/QALY; Low Care Value = >$150,000/QALY – Other Benefits or Disadvantages: Benefits or disadvantages offered by the intervention to the individual patient, caregivers, the delivery system, other patients, or the public that would not have been considered as part of the evidence on comparative clinical effectiveness –judged by independent appraisal committees – Contextual Considerations: ethical, legal, or other issues that influence the relative priority of illnesses and interventions (e.g., particularly high severity of disease)judged by independent appraisal committees – Provisional “Health System Value”: a judgment integrating consideration of the long-term care value of a new intervention with an analysis of its potential short-term budget impact –if the budget impact of a new intervention would contribute to an increase in overall health care costs at a rate greater than growth in the overall national economy, health system value would be diminished – Potential Budget Impact of Unmanaged Utilization: estimated net change in total health care costs over an initial 5-year time-frame –interventions are assigned uptake of very high (75% eligible patients), high (50% eligible patients), intermediate (25% eligible patients), and low (10% eligible patients) based on the following criteria: –magnitude of improvement in clinical safety and/or effectiveness –patient-level burden of illness –patient preference (ease of administration) –Proportion of eligible patients currently being treated –primary care vs. specialty clinician prescribing/use –presence or emergence of competing treatments of equal or superior effectiveness – Potential Budget Impact Threshold: Amount of net cost increase per individual new intervention that would contribute to growth in overall health care spending greater than the anticipated growth in national GDP +1%designed to serve as an “alarm bell” to invite greater scrutiny of drug pricing -“Value-Based Price Benchmarks”: represents the price at which patients in the population being considered could be treated with reasonable long-term value at the individual patient level and with added short-term costs that would not outstrip growth in the national economy Costs presented are the ICER, the overall budget impact, and the drug’s impact to overall healthcare spending Calculate a Value-Based Price Benchmark (VBPB) = Efficacy + Safety + Quality/Type of Evidence _ Total budget Impact + ICER/QALY + Other |
| OTHER: | – ICER plans 15 to 20 reports to be published within their first 2 years of launching this program – Does consider some market factors like novelty of therapy, public health benefit, treatment outcomes that reduce disparities across various patient groups, proportion of eligible patients currently being treated, primary care vs. specialty clinician prescribing/use, size of subpopulations, unmet need, burden/severity of illness |
Wrap-Up: Understanding Value Frameworks for Healthcare Providers and Executives
We have covered a lot in this introduction to understanding value frameworks.
Understanding these value frameworks can be extremely helpful to healthcare providers and executives as they prepare for similar scrutiny in the healthcare service sector.
At the heart of these frameworks is the demand to prove the value of healthcare products and services.
With tools like these value frameworks, key stakeholders in healthcare are now equipped to demand evidence to support their decisions to support or deny reimbursement for certain products and services.
While these value frameworks are all focused on the value of pharmaceuticals, we should expect similar efforts in other areas of medicine. After all, medications have traditionally hovered around 10% of the total healthcare bill. That leaves another 90% to target for cost inefficiencies.
I hope you found this article helpful in your understanding these emerging value frameworks. Please feel free to contact me with any questions or comments directly from our ‘CONTACT page.
In the meantime, be sure to sign up for our newsletter so you’ll get our articles delivered automatically to you immediately when they’re published.
References
| 1 | [1. Cherny NI, et al. A standardised, generic, validated approach to stratify the magnitude of clinical benefit that can be anticipated from anti-cancer therapies: the European Society for Medical Oncology Magnitude of Clinical Benefit Scale (ESMO-MCBS). Ann Oncol. 2015;26:1547-1573] |
|---|---|
| 2 | [1. Cherny NI, et al. A standardised, generic, validated approach to stratify the magnitude of clinical benefit that can be anticipated from anti-cancer therapies: the European Society for Medical Oncology Magnitude of Clinical Benefit Scale (ESMO-MCBS). Ann Oncol. 2015;26:1547-1573] |
| 3 | [2. Schnipper LE, et al. American Society of Clinical Oncology statement: A conceptual framework to assess the value of cancer treatment options. JCO. 2015;33:2563-2577] |
| 4 | [3. Schnipper LE, et al. Updating the American Society of Clinical Oncology value framework: Revisions and reflections in response to comments received. JCO. 2016;1-15] |
| 5 | [3. Schnipper LE, et al. Updating the American Society of Clinical Oncology value framework: Revisions and reflections in response to comments received. JCO. 2016;1-15] |
| 6 | [4. NCCN. Evidence Blocks. Available at: http://www.nccn.org/evidenceblocks/. Accessed March 2016] |
| 7 | [5. MSKCC. DrugAbacus. Available at: http://drugabacus.org. Accessed March 2016] |
| 8 | [7. ICER. Value Assessment Project. Available at: http://www.icer-review.org/impact-and-outcomes/value-assessment-project/. Accessed March 2016] |