
Healthcare executives and providers miss opportunities to enhance their business every day.
Why?
Because they get so mixed up in the day-to-day tasks of their job they ignore the most important part of every day… context.
And nothing provides greater context to every business in healthcare industry than the field of Health Economics.
Once you understand just a few basic principles of health economics, you’ll be able to apply them toward your own business success.
After reading this article, you will be able to:
- Define a few fundamental health economics principles
- Describe how health economics provides context to you healthcare business
- Know how to apply those principles to drive business results
So let’s get started…
Introduction to Health Economics
So what is health economics?
Health economics is a field of science in which the principles of economics are applied to the healthcare industry.
Before we let anxiety from college economics courses derail us, let’s consider the career advantages mastery of the subject offers.
Believe it or not, economics actually matters in the real world! And that makes it interesting and fun… Trust me 🙂
So let’s start with the difference between ECONOMICS and HEALTH ECONOMICS.
The American Economics Association defines ECONOMICS as:1 American Economic Association. What is economics. Available at: https://www.aeaweb.org/resources/students/what-is-economics. Accessed Sep 2016
The study of scarcity, the study of how people use resources, or the study of decision-making
The definition of HEALTH ECONOMICS highlights its focus on scarcity, resources, and decision-making IN HEALTHCARE:2 Health Economics. Available at: https://en.wikipedia.org/wiki/Health_economics. Accessed Sep 2016
Health economics is a branch of economics concerned with issues related to efficiency, effectiveness, value and behavior in the production and consumption of health and healthcare
To understand health economics, we will first look at a few key economics principles. In general, economics says private markets are an efficient way to allocate resources and maximize benefits from limited resources. But healthcare is different. We’ll highlight those differences as we go through each of the following principles:
- Production Possibilities Frontier
- Opportunity Cost
- Law of Demand
- Law of Supply
- Allocative Efficiency, Marginal Cost, and Marginal Benefit
The Value of Health Economics: Production Possibilities Frontier
Production Possibilities Frontier (PPF) Definition
The Production Possibilities Frontier (PPF) is a curve depicting all maximum output possibilities for two goods, given a set of inputs consisting of resources and other factors.3 Investopedia. Production Possibility Frontier -PPF. http://www.investopedia.com/terms/p/productionpossibilityfrontier.asp. Accessed Sep 2016 Importantly, the curve drawn assumes resources are used efficiently.
PPF Description and Use
Here is what a PPF curve looks like (Figure 1):
Figure 1. Production Possibilities Frontier (PPF)
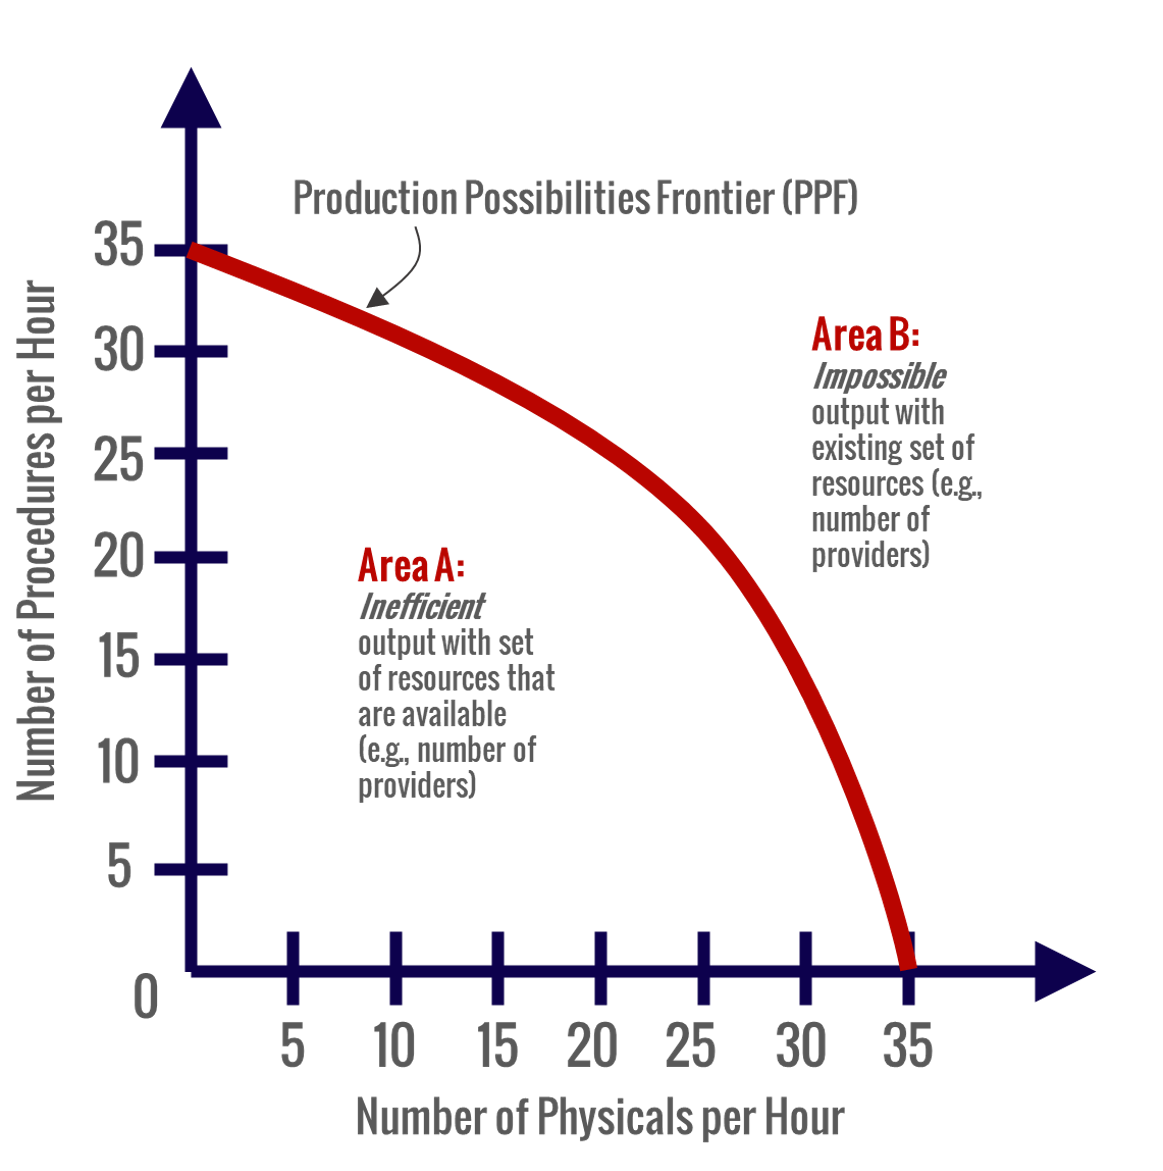
As you can see, the PPF plot maps two desirable outcomes against each other. These outcomes are those that are possible with a given set of resources. The PPF curve helps us visualize the trade-offs between these two outcomes.
In doing so, the curve creates two important areas – 1) the area under the curve, and 2) the area above the curve.
The area under the curve (Area A) illustrates inefficient use of resources to generate outcomes we want. The area above the curve (Area B) represents impossible outcomes based on the resources we currently have available.
PPF in Healthcare, Example
So how do we apply our PPF knowledge in our clinic?
In short, we can use the PPF results to inform what clinic activities we should prioritize.
Let’s look at our example above again.
In this case, our clinic is doing a lot of patient physicals and a lot of procedures.
Both produce revenue. But we’d like to understand the best mix of physicals and procedures to maximize clinic revenue.
Let’s assume our clinic has 5 trained providers to perform physicals and minor procedures. These providers represent our “resources” to obtain the benefits of physicals and procedures.
After looking at our clinic data and speaking with our providers, we plot the PPF (Figure 2).
A few things become obvious:
- Target output should be at least 35 physicals or 35 procedures per hour
- Targeting 20 to 25 physicals plus 20 to 25 procedures per hour maximizes our output (i.e., the bulge of the curve)
Figure 2. Production Possibilities Frontier (PPF) in Healthcare, Example
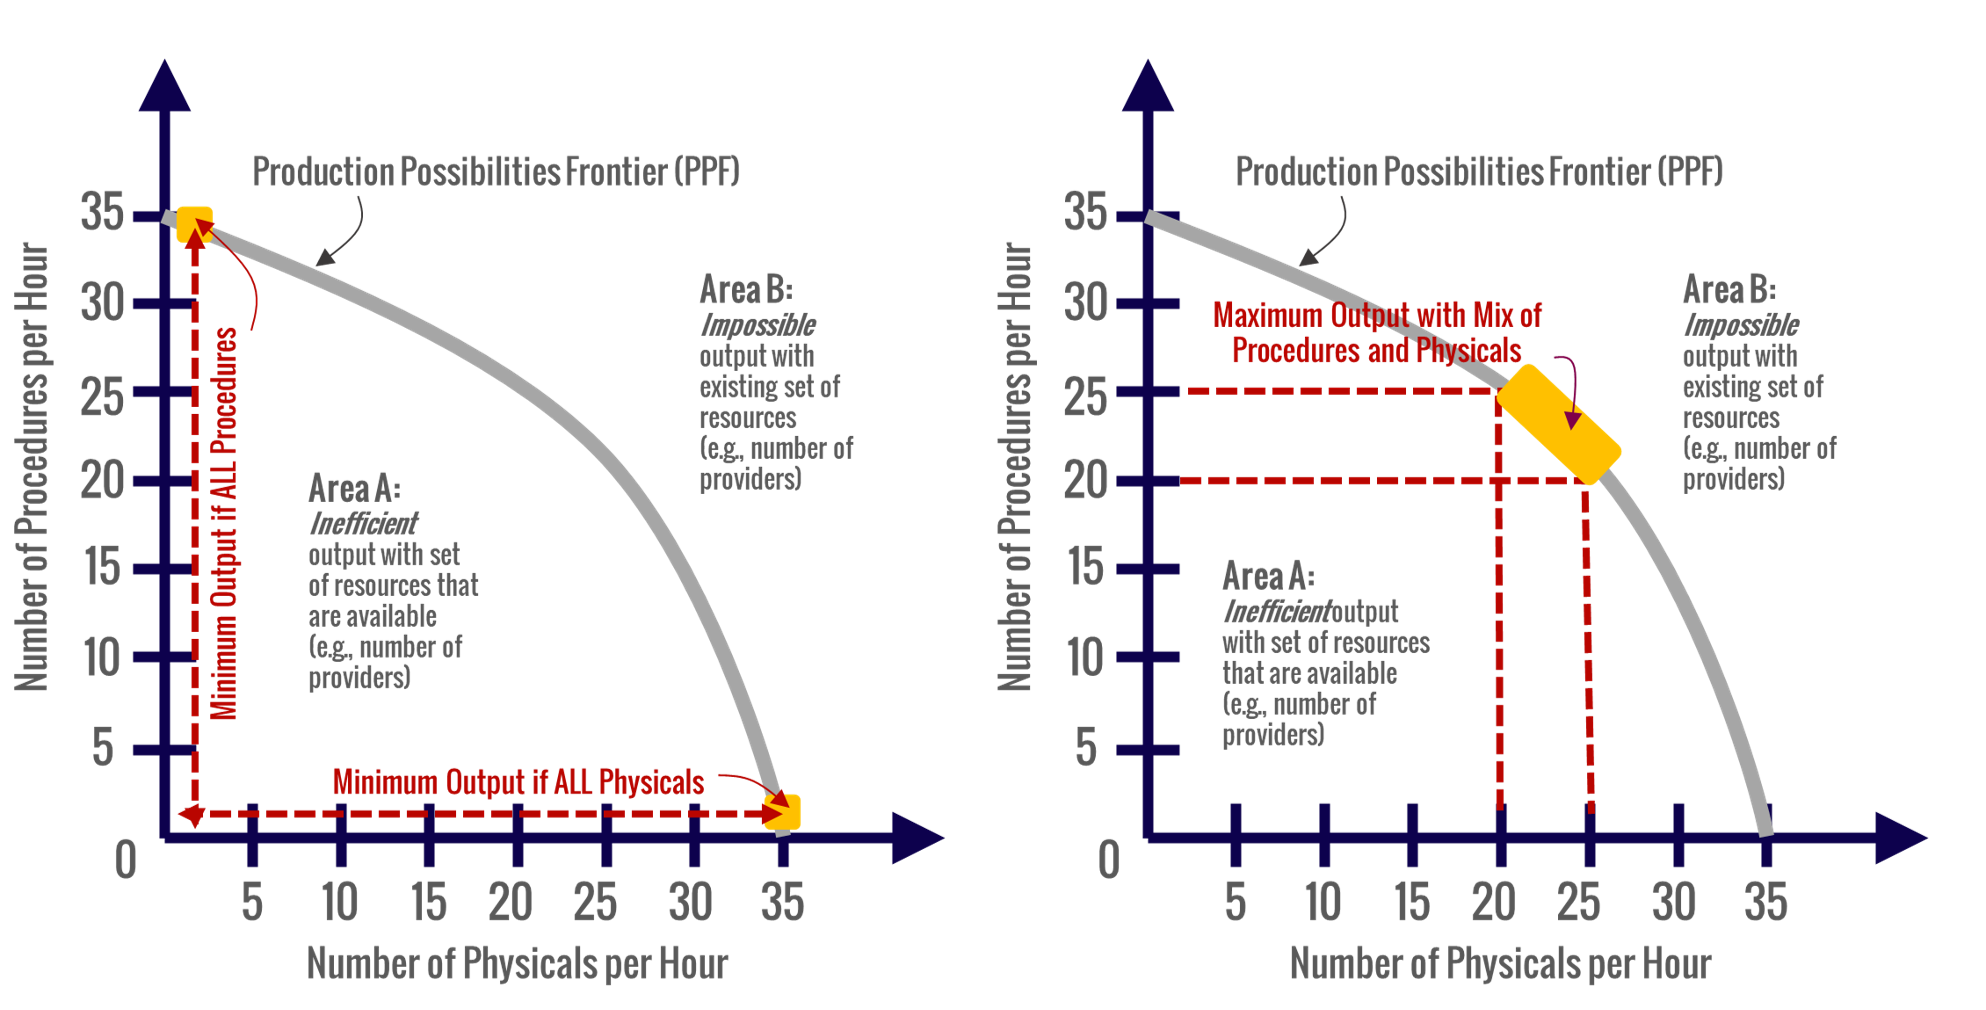
Let’s assume we make an average of $150 per physical and $170 per procedure. Since we make a bit more per procedure, we know to target 25 procedures and 20 physicals per hour.
The PPF has helped us understand that we should never be below 35 physicals and/or procedures per hour. It has also helped us understand we can push this goal to 45 physicals and/or procedures per hour with the right mix of each.
The Value of Health Economics: Opportunity Cost
Definition of Opportunity Cost
Opportunity cost may be one of the most well-understood economics concepts.
Opportunity cost is defined as:4 Investopedia. Opportunity Cost. Available at: http://www.investopedia.com/terms/o/opportunitycost.asp. Accessed Sep 2016
A benefit that a person could have received, but gave up, to take another course of action
Description and Use of Opportunity Cost
Perhaps the reason opportunity cost is commonly understood is that we all experience its impact in our daily lives.
We want to exercise, but we end up sleeping in.
We want eggs and bacon for breakfast but settle for bran cereal.
We’d like to buy that new Corvette, but food and mortgage take priority.
We feel the loss that opportunity cost refers to.
We make choices to say “yes” to some things that automatically make “no” the answer to other things (and vice-versa).
The driving force behind it all is the fundamental concept of limited resources.
Opportunity Cost in Healthcare
So what does opportunity cost look like for our healthcare business.
Similar to running our personal affairs, we also make lots of trade-off decisions for our healthcare business. We know well the experience of limited resources that prevent other desired outcomes we’d like to achieve for our business.
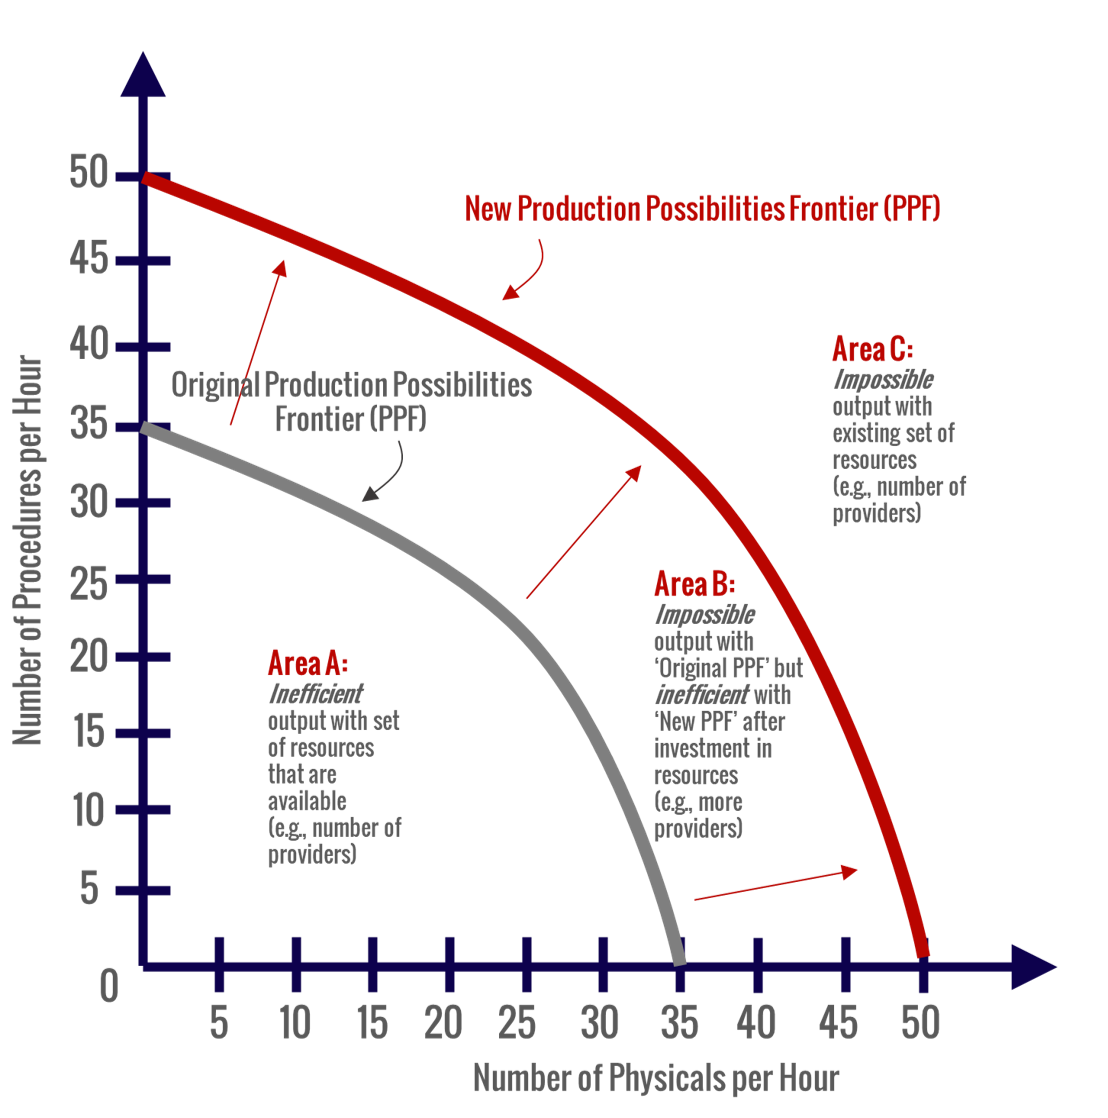
Let’s consider our example above again (Figure 3).
First, we know we are limited to just 35 physicals or 35 procedures per hour. Furthermore, our greatest output is limited to 45 of some mix of these. The opportunity cost is the ability to make more money by increasing these numbers. However, our PPF illustrated that is just not possible without an investment in more resources. This might require more training for existing staff to improve output or hiring additional staff. Furthermore, we’d need to make sure we have the customer demand for these services.
Figure 3. Opportunity Cost in Healthcare, Example
Understanding Health Economics: Law of Demand
Defining the Law of Demand
Demand is another concept that most of us have some intuition about.
But how is it defined?
The following definition explains a lot about the law of demand:5 Investopedia. Law of Demand. Available at: http://www.investopedia.com/terms/l/lawofdemand.asp. Accessed Sep 2016
The law of demand is a microeconomic law that states, all other factors being equal, as the price of a good or service increases, consumer demand for the good or service will decrease, and vice versa. The law of demand says that the higher the price, the lower the quantity demanded, because consumers’ opportunity cost to acquire that good or service increases, and they must make more tradeoffs to acquire the more expensive product.
Description and Use of the Law of Demand
As prices increase, demand decreases… and vice-versa.
This is pretty intuitive for most of us.
After all, we experience the law of demand in our personal purchasing decisions all the time.
We learn to say “no” to things when prices go up and “yes” when they start falling… when they are on sale.
As the definition of the law of demand highlights, such decisions are driven by the opportunity costs they represent.
When prices go up, the opportunity cost of buying ALSO increases. That’s why it becomes harder for us to actually spend the money.
The opposite is also true. When prices go down, we feel like we have to give up less (i.e., less opportunity cost) to gain the same benefit.
The Law of Demand in Healthcare
The law of demand is ubiquitous in healthcare.
In summary, we can see the law of demand present in any healthcare product or service. Each of these has a given price. The demand for those particular products is driven by prices.
Let’s take a look at a demand curve for PRICE by the Number of Clinic Visits Per Day (Figure 4):
Figure 4. The Law of Demand in Healthcare, Example
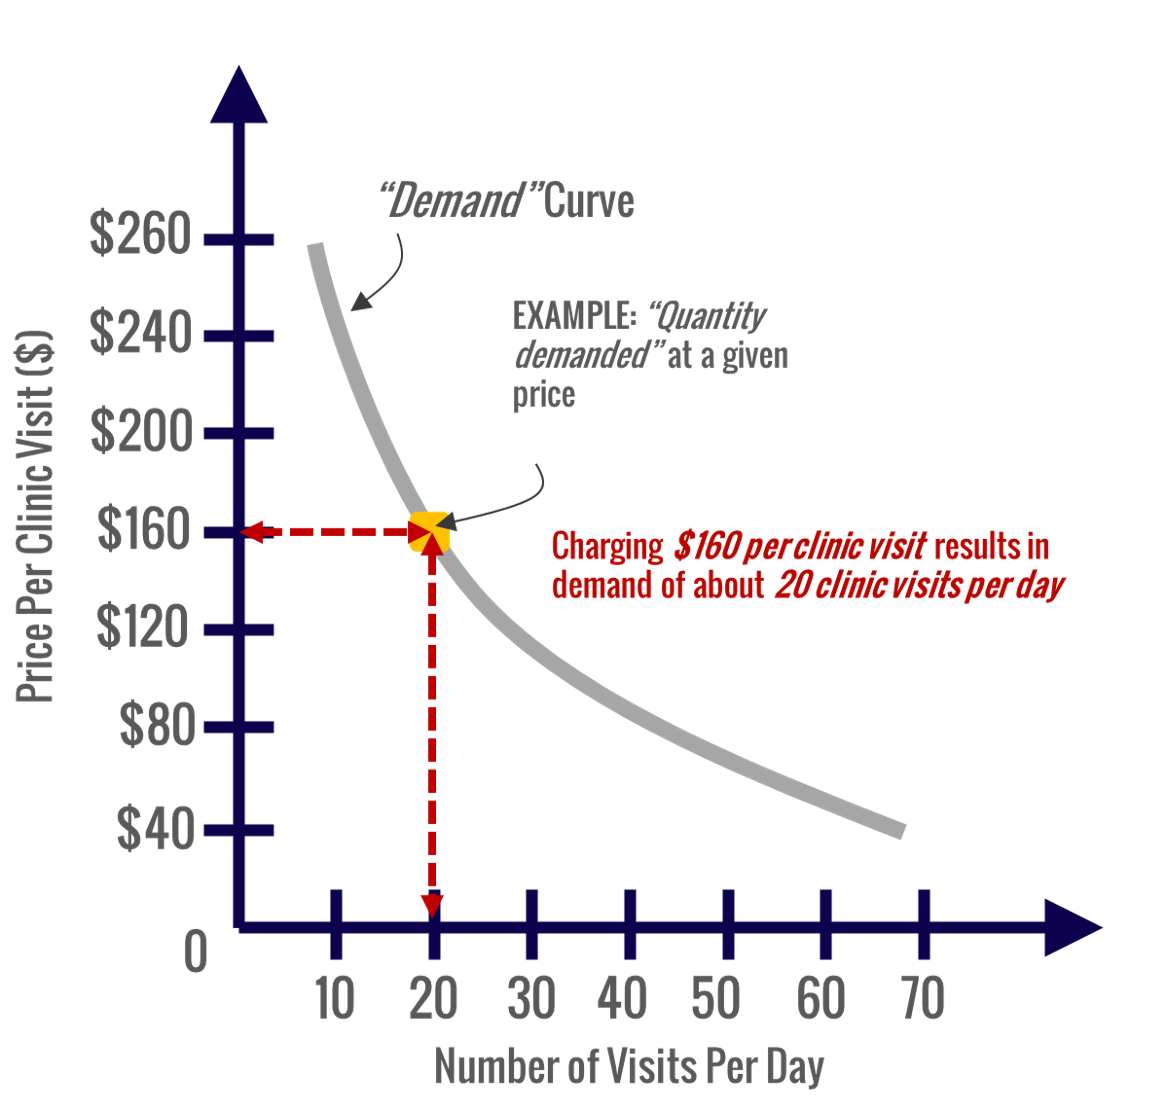
There are a few important features of the demand curve that will help us understand what we are looking at.
- The demand curve is created by plotting increasing PRICEs on the y-axis and increasing UNITS of some product or service DEMANDED on the x-axis.
- The term “demand curve” refers to the entire curve as comprised by its many x-y pairs of units by price.
- The individual points on the demand curve reflect how many units people will buy (i.e., demand) at its associated price
In the graph, we can see that if we charge $160 per visit, we can anticipate about 20 patients to visit each day. Notice how the number jumps to 70 visits per day when we charge only $40. We also see that there are a few patients willing to pay up to $260 per visit.
The demand curve alone won’t tell us the optimum price to charge. For that, we’ll need to look at the supply curve with it.
Understanding Health Economics: Law of Supply
Defining the Law of Supply
While many have heard of the law of supply, fewer really understand it.
Most of us do not experience this law each day like we do the law of demand.
Of course, those who start and run businesses are much more familiar with the law of supply.
The law of supply involves decisions around how much to PRODUCE of something and how to PRICE it. These businessmen are faced with decisions built off the law of supply.
The Law of Supply is defined as follows:6 Investopedia. Law of Supply. Available at http://www.investopedia.com/terms/l/lawofsupply.asp. Accessed Sep 2016
The law of supply is the microeconomic law that states that, all other factors being equal, as the price of a good or service increases, the quantity of goods or services that suppliers offer will increase, and vice versa. The law of supply says that as the price of an item goes up, suppliers will attempt to maximize their profits by increasing the quantity offered for sale.
Description and Use of the Law of Supply
The key feature of the law of supply is that it takes the supplier’s perspective.
It asks and answers questions about how much the market will supply for any given product or service based on the amount of money people are willing to spend on that product or service.
As prices increase, supply increases. This is because those who produce products and services see the opportunity to make more money.
At a macro level, businesses even change what they will supply as financial opportunities become greater in other areas. For example, when the price of wheat sky-rockets, farmers switch growing corn on their land for wheat.
The Law of Supply in Healthcare
The law of supply is evident across many different healthcare products and services.
Products may include medical devices and pharmaceutical products.
Services may include doctors visits, urgent care visits, emergency room visits, hospitalizations, radiology center services, etc.
For each of these entities, there is a given supply within a given region. That supply commands a particular price.
Let’s take a look at an example supply curve (Figure 5):
Figure 5. The Law of Supply in Healthcare, Example
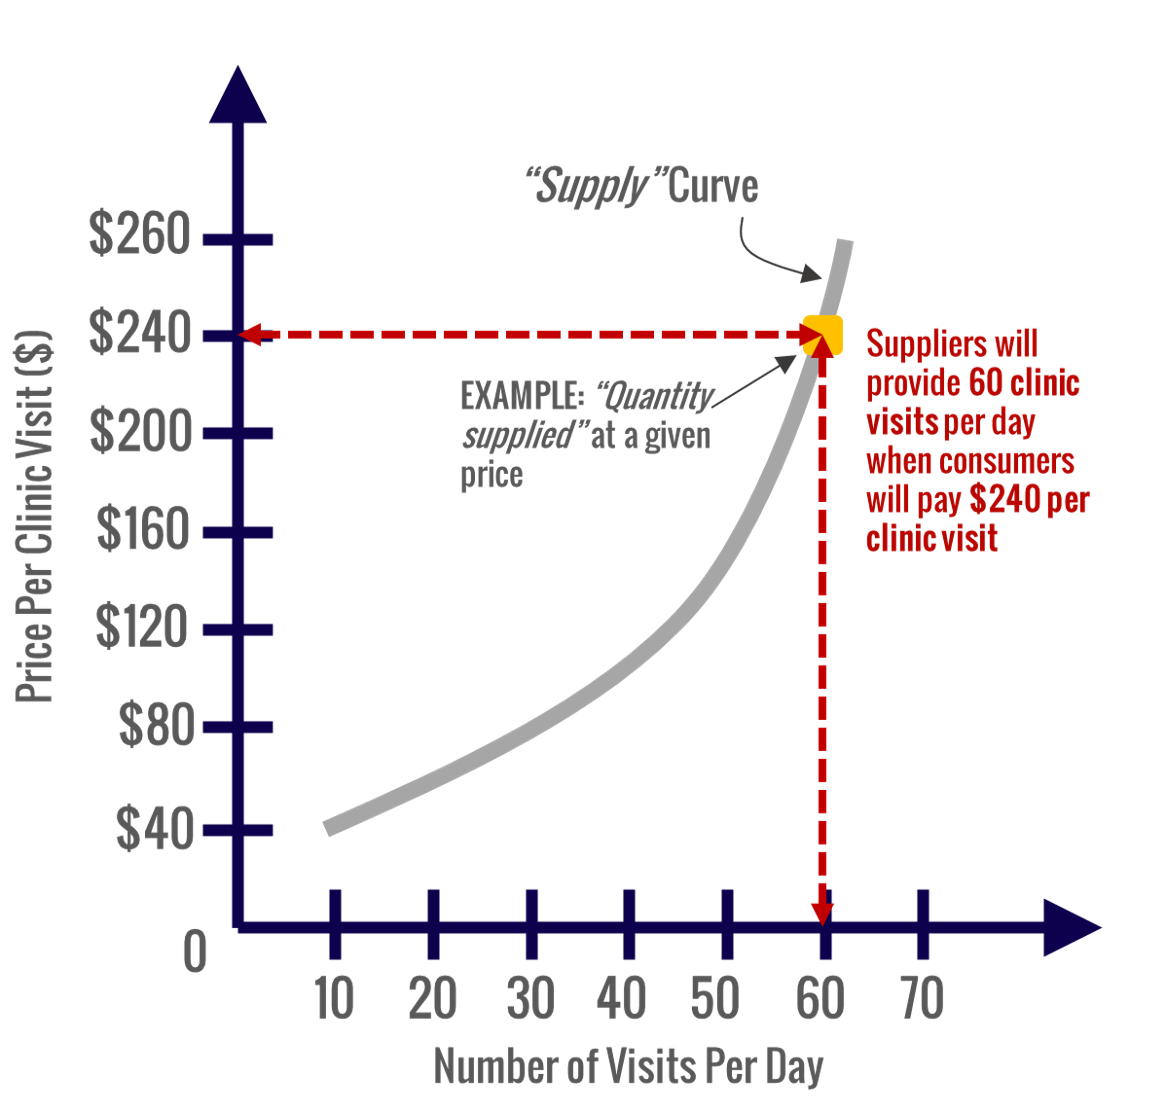
Like the demand curve, there are a few important features of the supply curve that will help us understand what we are looking at.
- The supply curve is created by plotting increasing PRICEs on the y-axis and increasing UNITS of some product or service SUPPLIED on the x-axis.
- The term “supply curve” refers to the entire curve as comprised by its many x-y pairs of units by price.
- The individual points on the supply curve reflect how many units will we will produce (i.e., supply) at its associated price
In the graph, we can see that when the market is willing to pay $240 per visit, suppliers will provide about 60 visits per day. Notice how the number drops to 10 visits per day when we charge only $40.
Remember, when we looked at the demand curve, we saw that at a charge of only $40 per visit we had demand for 70 visits per day. There is a big discrepancy here!
This discrepancy highlights the need to look at demand and supply together. We need to do this to find the optimized balance between how much suppliers are willing to produce and the price that will drive the right level of demand.
The demand curve alone won’t tell us the optimum price to charge. For that, we’ll need to look at the supply curve along with it. We need to look at our “market equilibrium”
Understanding Health Economics: Market Equilibrium
Defining the Market Equilibrium
Our review of the law of demand and the law of supply highlighted a problem.
We see vast differences in the demand for products/services at given prices vs what producers are willing to supply for those given prices.
The definitions of market equilibrium and equilibrium price are as follows:7 Market Equilibrium. Available at: http://study.com/academy/lesson/market-equilibrium-in-economics-definition-examples-quiz.html. Accessed Sep 2016.
Market equilibrium is a market state where the supply in the market is equal to the demand in the market. The equilibrium price is the price of a good or service when the supply of it is equal to the demand for it in the market.
Market Equilibrium in Healthcare
So let’s look at our example in healthcare (Figure 6).
Here is our demand and supply curve plotted on the same graph. As such, we can determine our market equilibrium and its associated price and quantity supplied.
Figure 6. Market Equilibrium in Healthcare, Example
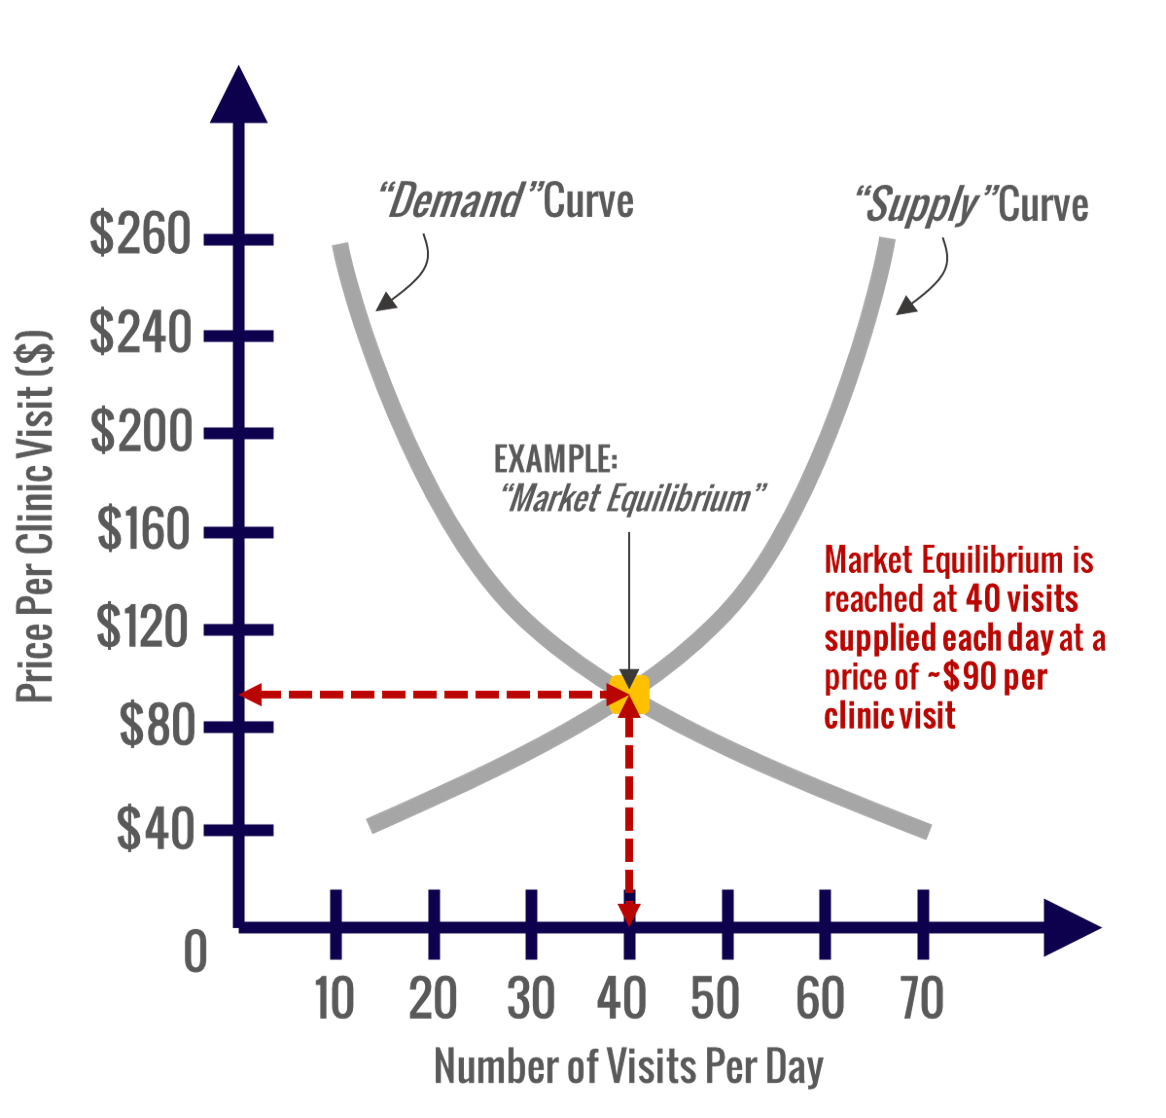
Based on our demand and supply curves, we can determine our market equilibrium. In this case, the curves cross at about 40 visits per day supplied and demanded at a prices of about $90 per clinic visit.
Based on this graph, we can also tell many other things.
We can tell suppliers are being inefficient if they supply more than 40 visits per day. They will not have enough patients schedule appointments to fill 40 slots per day.
Understanding Health Economics: Allocative Efficiency, Marginal Cost, and Marginal Benefit
Allocative Efficiency, Marginal Cost, and Marginal Benefit in Economics
In order to understand the concepts of allocative efficiency, marginal cost, and marginal benefit, we simply need to consider exactly what we give up and what we gain with any given decision.
Whereas above, we were looking at the raw costs/prices and raw numbers of units… here we consider the incremental changes in those values as we move from one scenario to another.
Let’s take a look at the definitions.
Allocative Efficiency is defined as follows:8 Definition of Allocative Efficiency. Available at: http://www.economicshelp.org/blog/glossary/allocative-efficiency/. Accessed Sep 2016.
This occurs when there is an optimal distribution of goods and services, taking into account consumer’s preferences.
A more precise definition of allocative efficiency is at an output level where the price equals the Marginal Cost (MC) of production. This is because the price that consumer’s are willing to pay is equivalent to the marginal utility that they get. Therefore the optimal distribution is achieved when the marginal utility of the good equals the marginal cost.
Marginal Cost is defined as:9 Accounting Coach. What is Marginal Cost. Available at: http://www.accountingcoach.com/blog/what-is-marginal-cost. Accessed Sep 2016.
Marginal cost is the cost of the next unit or one additional unit of volume or output.
Marginal Benefit is defined as follows:10 Investopedia. Marginal benefit. Available at: http://www.investopedia.cm/terms/m/marginalbenefit.asp. Accessed Sep 2016.
A marginal benefit is the additional satisfaction or utility that a person receives from consuming an additional unit of a good or service. A person’s marginal benefit is the maximum amount he is willing to pay to consume that additional unit of a good or service. In a normal situation, the marginal benefit decreases as consumption increases.
Allocative Efficiency, Marginal Cost, and Marginal Benefit in Health Economics
When we examine allocative efficiency, marginal cost, and marginal benefit in the context of healthcare, we quickly notice breakdowns.
You see, healthcare is known as a “broken” (i.e., “inefficient) market. Three driving facts for this inefficiency are the following:
- Prices for healthcare products and services are typically unknown by purchasers
- Costs for healthcare products and services are often split between their ultimate consumer and some other entity like a health insurance company
- Quality of products and services are not fully understood by their purchasers
Allocative efficiency in healthcare would require healthcare decision-makers be able to make choices based on their preferences for healthcare products and services as informed by knowledge of prices and quality. It requires producers and consumers of healthcare know their marginal costs and marginal benefits in an aggregate level… enough to drive efficiency.
The reality is that accurate insights on both pillars – prices and quality – is lacking across the healthcare industry.
Marginal cost would require the healthcare provider know the extra cost of producing an additional office visit based on patient preferences. And marginal benefit would require patients understand the benefit of one extra visit to the clinic. But are either really well-known?
Consider a clinic that provides MRIs. The production side of the business (i.e., the clinic) ideally understands the marginal cost and benefit of producing each additional MRI and patient preferences for MRIs. While marginal costs and benefits may be tracked by the savvy clinic, patient preferences for MRI are largely unknown.
The consumption side (i.e., the patient) ideally understands the marginal cost and benefits of getting an MRI. Here, costs are largely unknown and typically at least partially shared by a third-party payer (i.e., health insurer). And quality of MRI is unknown to the patient. Thus, it is rare that the healthcare consumer makes a choice based on cost or quality.
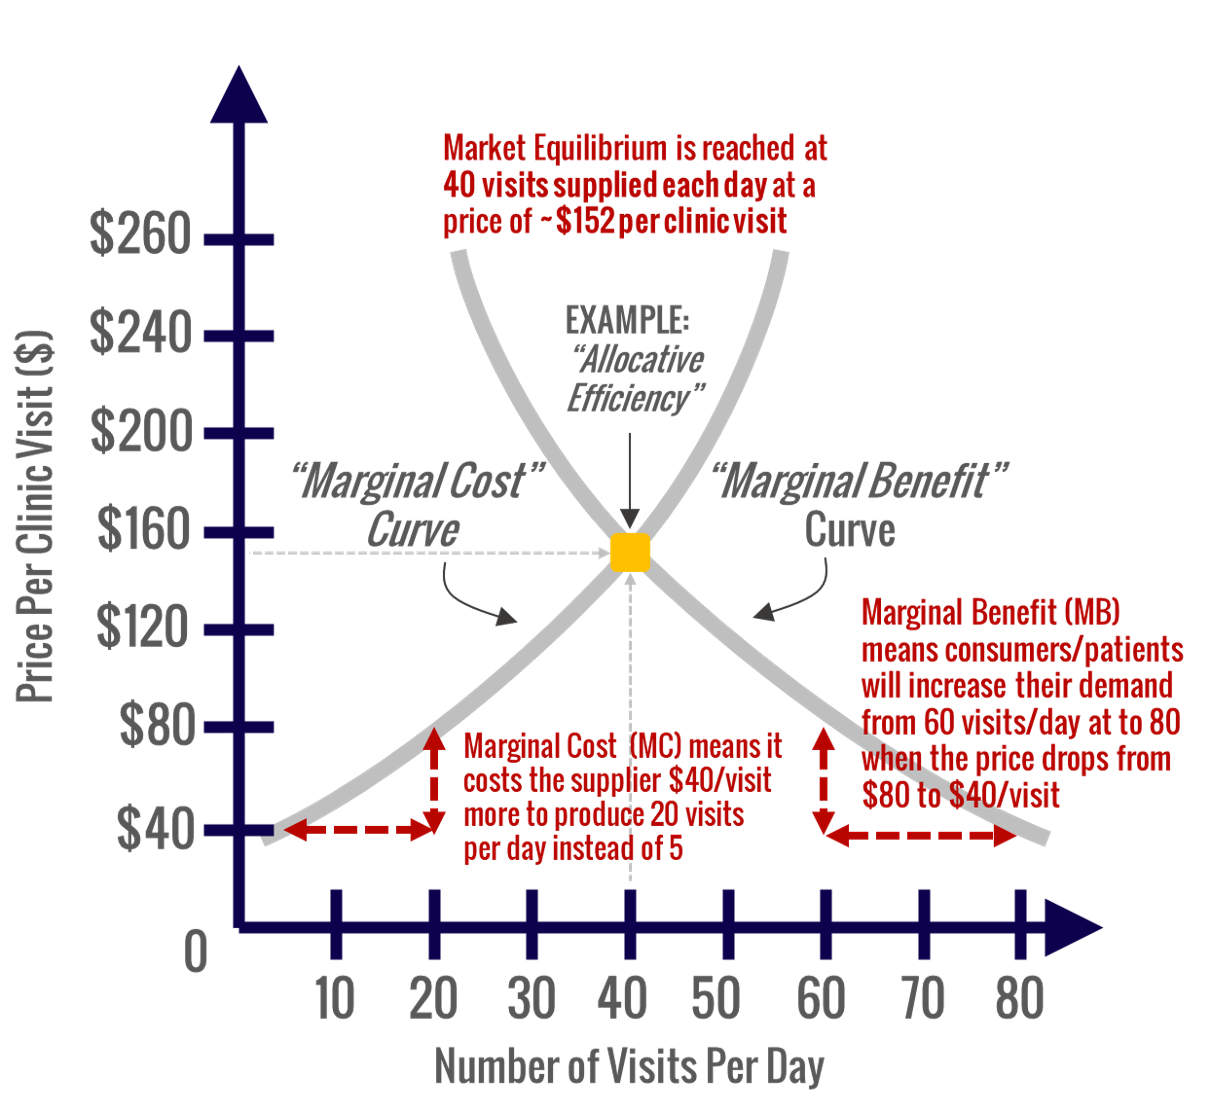
Figure 7 illustrates allocative efficiency, the marginal cost curve, and the marginal benefit curve.
Figure 7. Allocative Efficiency, the Marginal Cost Curve, and the Marginal Benefit Curve in Healthcare, Example
Wrap Up: The Value of Health Economics for Healthcare Executives and Providers
We have reviewed how the field of health economics provides critical context for every business in healthcare.
And that knowing just a little about health economics can provide healthcare executives and providers a competitive advantage and help them boost their bottom line.
We saw the relevance to the bottom line of any healthcare business of each of the following principles from health economics:
- Production Possibilities Frontier
- Opportunity Cost
- Law of Demand
- Law of Supply
- Allocative Efficiency, Marginal Cost, and Marginal Benefit
I hope this article helped you see the potential of understanding health economics to your business growth and profit.
Please contact us if you’d like to hear more about how we can help your business with these principles.
References
| 1 | American Economic Association. What is economics. Available at: https://www.aeaweb.org/resources/students/what-is-economics. Accessed Sep 2016 |
|---|---|
| 2 | Health Economics. Available at: https://en.wikipedia.org/wiki/Health_economics. Accessed Sep 2016 |
| 3 | Investopedia. Production Possibility Frontier -PPF. http://www.investopedia.com/terms/p/productionpossibilityfrontier.asp. Accessed Sep 2016 |
| 4 | Investopedia. Opportunity Cost. Available at: http://www.investopedia.com/terms/o/opportunitycost.asp. Accessed Sep 2016 |
| 5 | Investopedia. Law of Demand. Available at: http://www.investopedia.com/terms/l/lawofdemand.asp. Accessed Sep 2016 |
| 6 | Investopedia. Law of Supply. Available at http://www.investopedia.com/terms/l/lawofsupply.asp. Accessed Sep 2016 |
| 7 | Market Equilibrium. Available at: http://study.com/academy/lesson/market-equilibrium-in-economics-definition-examples-quiz.html. Accessed Sep 2016. |
| 8 | Definition of Allocative Efficiency. Available at: http://www.economicshelp.org/blog/glossary/allocative-efficiency/. Accessed Sep 2016. |
| 9 | Accounting Coach. What is Marginal Cost. Available at: http://www.accountingcoach.com/blog/what-is-marginal-cost. Accessed Sep 2016. |
| 10 | Investopedia. Marginal benefit. Available at: http://www.investopedia.cm/terms/m/marginalbenefit.asp. Accessed Sep 2016. |