
NOTE: This article is the seventh in a series of 10 articles and is part of our Economic Evaluation in Healthcare 101 course. You can find a course overview and links to all 10 course modules here:
- Economic Evaluation in Healthcare 101: Course Overview
- Introduction to Economic Evaluation in Healthcare
- Types of Economic Evaluation in Healthcare
- Measuring Costs in Healthcare
- Measuring Health Outcomes
- Decision Analytic Modeling in Economic Evaluation
- Data Sources for Economic Evaluation in Healthcare
- Interpreting and Applying Economic Evaluation Results in Healthcare
- Economic Evaluation in Health Technology Assessment (HTA)
- Ethical and Equity Considerations in Economic Evaluation
- Future Trends in Economic Evaluation in Healthcare
Interpreting and Applying Economic Evaluation Results in Healthcare
Economic evaluations play a critical role in healthcare decision-making by providing evidence on the value for money of medical interventions. However, producing robust cost and outcome data is only part of the process; interpreting and applying these results is just as vital. Key tools used in this process include the cost-effectiveness plane, incremental cost-effectiveness ratios (ICERs), and willingness-to-pay (WTP) thresholds. These concepts help stakeholders—especially policymakers—evaluate the relative costs and benefits of competing interventions, thereby guiding resource allocation decisions in a transparent and evidence-informed way.
1. The Cost-Effectiveness Plane: A Visual Framework for Interpretation
The cost-effectiveness plane is a foundational graphical tool used to interpret economic evaluation results. It consists of four quadrants formed by plotting the incremental cost on the vertical axis and incremental effectiveness (e.g., QALYs) on the horizontal axis, relative to a comparator intervention.
- Northeast quadrant (↑ cost, ↑ effect): New intervention is more effective but more expensive. Decision depends on cost-effectiveness.
- Northwest quadrant (↑ cost, ↓ effect): New intervention is more costly and less effective—dominated and rejected.
- Southeast quadrant (↓ cost, ↑ effect): New intervention is less costly and more effective—dominant and adopted.
- Southwest quadrant (↓ cost, ↓ effect): Less costly but less effective; decision depends on trade-off and WTP.
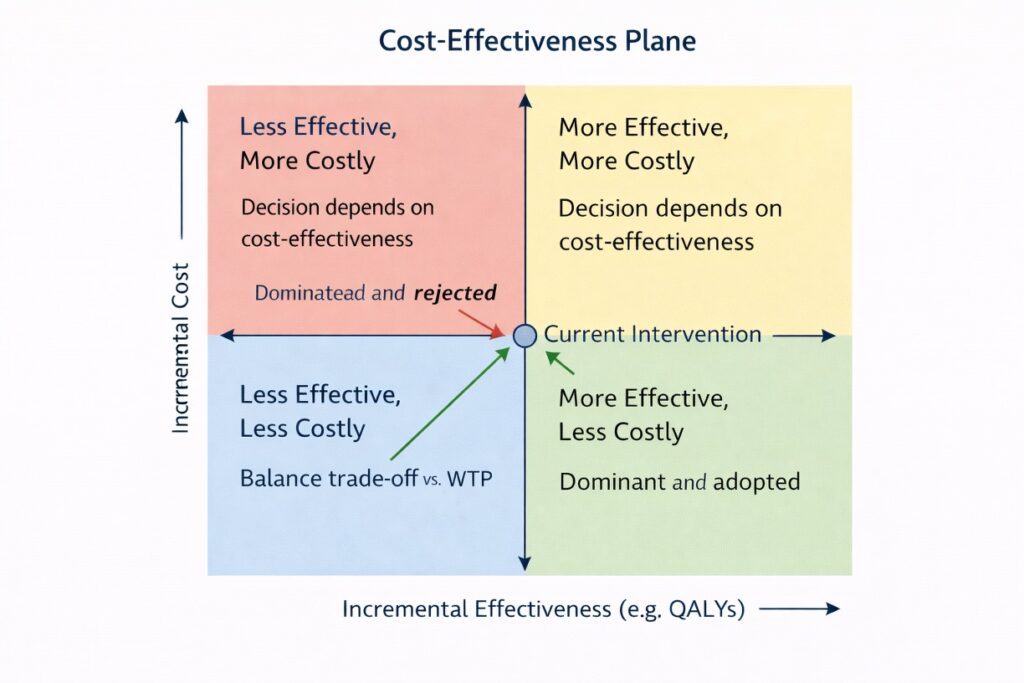
The plane helps decision-makers visually assess the value of interventions, especially when paired with uncertainty analysis like probabilistic sensitivity analysis (PSA), which can show the distribution of outcomes as a cloud of points across the plane.
Reference: Drummond MF, Sculpher MJ, Claxton K, et al. (2015). Methods for the Economic Evaluation of Health Care Programmes, 4th ed.
2. Incremental Cost-Effectiveness Ratio (ICER): Quantifying Value for Money
The Incremental Cost-Effectiveness Ratio (ICER) is the most common summary statistic used in cost-effectiveness analysis. It quantifies how much additional cost is required to achieve one additional unit of health benefit from a new intervention compared to an alternative.
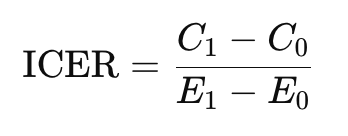
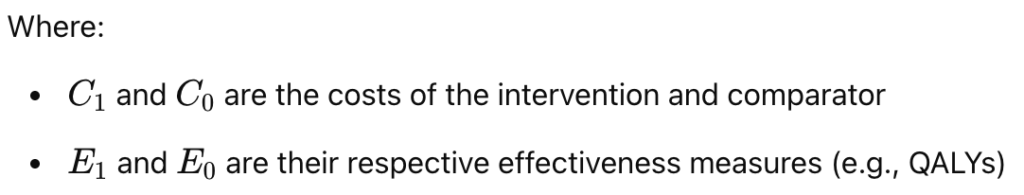
where:
Example:
If a new drug costs $10,000 more than standard care and provides 0.5 additional QALYs, the ICER is:

Interpreting ICERs involves comparing them to a willingness-to-pay threshold to determine if the intervention provides acceptable value.
Reference: Neumann PJ, Sanders GD, Russell LB, et al. (2016). Cost-Effectiveness in Health and Medicine, 2nd ed.
3. Willingness-to-Pay (WTP) Thresholds: Benchmarks for Decision-Making
The willingness-to-pay (WTP) threshold represents the maximum amount a health system or society is willing to pay for one additional unit of health benefit, such as a QALY. It serves as a benchmark for interpreting ICERs:
- If ICER < WTP, the intervention is considered cost-effective.
- If ICER > WTP, it may not be adopted unless additional justification exists (e.g., disease severity, equity concerns).
Examples of WTP thresholds:
- United Kingdom (NICE): £20,000–30,000 per QALY
- United States: Commonly referenced thresholds are $50,000–$150,000 per QALY
- World Health Organization (WHO): Up to 1–3 times a country’s per capita GDP per DALY averted (though this guideline is now debated)
Challenges with WTP thresholds:
- There is often no consensus on the “right” threshold.
- WTP may vary by disease area, societal preferences, or budget constraints.
- In lower- and middle-income countries, formal thresholds are rarely established, complicating global comparisons.
Reference: Claxton K, Martin S, Soares M, et al. (2015). Methods for the estimation of the NICE cost-effectiveness threshold. Health Technology Assessment, 19(14), 1–503.
4. How Policymakers Use Economic Evaluation in Resource Allocation
Policymakers and health technology assessment (HTA) agencies use economic evaluations to prioritize interventions that deliver the greatest health gain per dollar spent. Economic evidence informs decisions related to:
- Reimbursement and coverage (e.g., whether a new drug should be publicly funded)
- Clinical guidelines (e.g., when to recommend new diagnostics or screening tools)
- Public health investments (e.g., expanding vaccination programs)
- De-implementation of low-value or cost-ineffective interventions
Prominent agencies include:
- NICE (UK)
- CADTH (Canada)
- PBAC (Australia)
- ICER (US)
In practice, economic evaluations are reviewed alongside clinical effectiveness, budget impact, ethical considerations, and societal values. For instance, an intervention slightly above the WTP threshold may still be approved if it addresses a severe condition or improves health equity.
Constraints and considerations:
- Budget constraints: Even cost-effective interventions may be unaffordable if budget caps exist.
- Equity and access: Policymakers must weigh efficiency against fairness.
- Uncertainty: High uncertainty in estimates can affect confidence and lead to risk-sharing agreements (e.g., managed entry schemes).
Reference: Chalkidou K, Glassman A, Marten R, et al. (2017). Priority-setting for achieving universal health coverage. Bulletin of the WHO, 95(11), 807–812.
Conclusion
Interpreting and applying the results of economic evaluations is a nuanced process that requires both technical rigor and contextual judgment. Tools like the cost-effectiveness plane, ICERs, and WTP thresholds provide a structured framework for comparing interventions, while policymakers use these insights to guide healthcare resource allocation. Ultimately, the goal is to ensure that limited resources are used efficiently and ethically to maximize health outcomes across populations.
References
- Drummond MF, Sculpher MJ, Claxton K, Stoddart GL, Torrance GW. (2015). Methods for the Economic Evaluation of Health Care Programmes, 4th ed. Oxford University Press.
- Neumann PJ, Sanders GD, Russell LB, Siegel JE, Ganiats TG. (2016). Cost-Effectiveness in Health and Medicine, 2nd ed. Oxford University Press.
- Claxton K, Martin S, Soares M, et al. (2015). Methods for the estimation of the NICE cost-effectiveness threshold. Health Technology Assessment, 19(14), 1–503.
- Chalkidou K, Glassman A, Marten R, et al. (2017). Priority-setting for achieving universal health coverage. Bulletin of the WHO, 95(11), 807–812.